AGI is proud to introduce the new EarthImager 3D resistivity and IP inversion software. This software inverts resistivity and IP data acquired with electrodes arranged in boreholes and/or on the surface and presents a 3D volume of inverted resistivity data with advanced volume rendering technique. The final resistivity or IP image-volume can be rotated in any orientation, zoomed in and out, and translated to anywhere inside the image window in order to see the volume of interest in detail. Colors representing areas of less interest can be made transparent so that the shape of a pollution plume, for example, can be visible. With EarthImager, 3D resistivity inversion can be as easy as two steps: Read Data and Start Inversion with only a few mouse clicks.
Download Free DEMO!
You can test AGI EarthImager 3D yourself by downloading the demo.
It is fully functional except some features like printing and saving has been disabled and the maximum iteration number is limited.
Some of the features of the EarthImager 3D are:
- Fast hardware-accelerated 3D graphics powered by OpenGL.
- 3D volumetric rendering with transparency control.
- Inversion of 3D surface resistivity data.
- Inversion of 3D borehole resistivity data.
- Inversion of 3D IP data.
- Finite difference forward modeling.
- Options of boundary condition for forward modeling.
- Smooth model inversion.
- User friendly Windows GUI.
- Noisy data suppression.
- No software limit on number of data points or number of electrodes.
- No limit on array type or electrode location.
- Seamless operation with AGI resistivity instruments.
- Windows true 24-bit color.
- Trackable and retrievable user settings.
- Tool buttons and popup menus for easy access to frequently used menu items.
- Inversion progress bar to show the inversion status.
- Well organized and hassle-free processing directory structure.
- Saving images in bitmap, JPEG, PostScript, PNG, and TIFF file formats.
- Saving image data in XYZ format so it can be loaded into any off-shelf graphics software.
- Volume and multiple-slice images.
- Interactive slice image.
- Data misfit cross-plot.
- Convergence curve.
- User-specified minimum and maximum variable values of the image.
- User-specified colors and contour levels.
More features will be added continuously.
AGI EarthImager 3D Video
(NOTE:
Requires Windows Media Player to be installed!
The default player for video clips must be set to Windows Media Player!
If you use Real Player then you cannot view the video clip!)
Click the play button to view video (may take some time to load on slow connections).
Tip: You can drag the position button to any scene for detailed study.
To play the 3D video, increase your hardware acceleration to the FULL level if no video shows up.
Screenshots with explanations:

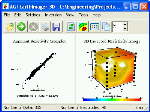
Figure 1:
The left image shows the arrangement of the electrodes, in this case, in 5 boreholes. The electrodes can be arranged both in boreholes and/or on the surface. The right picture shows the scatter plot of measured apparent resistivity. By left clicking on one data point in this picture the corresponding four active electrodes are showed as red electrodes (current) and blue electrodes (potential), and the picked data point as a black dot.

Figure 2:
The electrode arrangement on the left side can be rotated or turned in any way so that electrodes further back, which are blocked from view by electrodes closer, can be seen. The inversion is started by clicking on the green button with the arrow.

Figure 3:
When the inversion is started a crossplot of measured versus calculated apparent resistivities is shown to the left. Ideally all of the dots should end up on a 45 degree line for noise-free data and error-free numerical modeling. The right image shows a 3D volume of inverted resistivity. Resistivity inversion is an iterative process. These two images will update at the end of each iteration.

Figure 4:
At the end of inversion, the user can customize the data range (min and max), plot scale (linear or logarithmic), and color transparency or opacity (Figure 5 below) from the Color and Contour Properties window.

Figure 5:
The transparency of each color can be changed by dragging or clicking anywhere inside the grid. A color with 0 opacity would be totally transparent and a color with an opacity value of 1 will be solid. By manipulating the opacity, a user can investigate different volume of interest inside the imaging volume.

Figure 6:
The maximum resistivity value is set to 50 ohm-m, and resistivity values below 10 ohm-m (blue and green colors) are made transparent.

Figure 7:
These dynamic slices are a powerful tool for interactive data interpretation. Any of three slices may be turned on or off. Any slice can be moved along the axis to sweep through the entire volume in search for anomalies. A left mouse clicking on a slice would reveal the x, y, z coordinate and corresponding resistivity value. In addition, EarthImager also shows a stack of four static slices in either X, Y or Z orientation.